
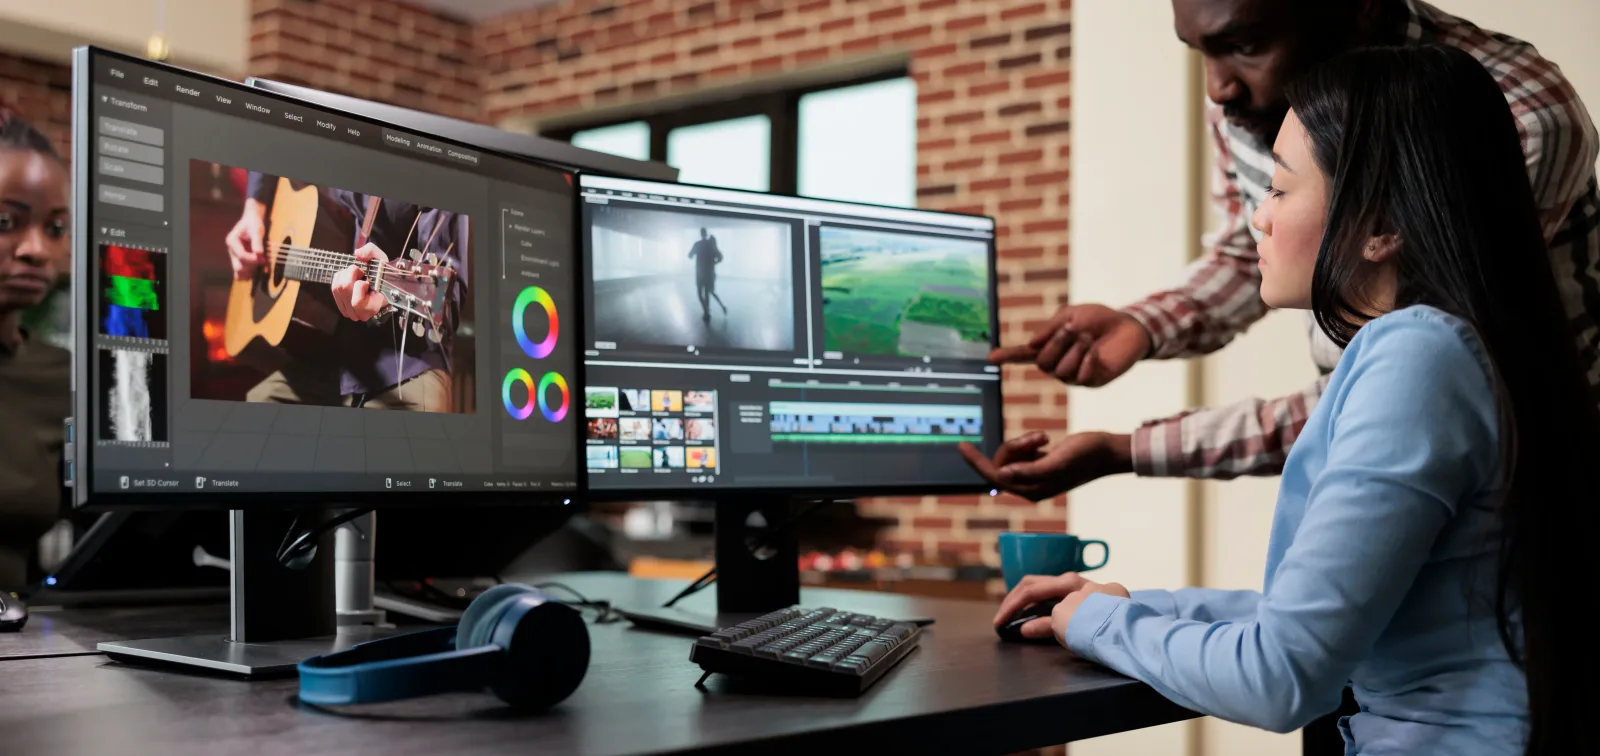
Tech giants and CXOs are the architects of tomorrow's technology. They are constantly at the forefront, pushing boundaries and developing groundbreaking ideas, shaping the future of technology. However, for these advancements to truly thrive, a crucial element is needed: seamless user experiences. This is where globally recognized visual graphic design experts step in, playing a pivotal role in shaping the future of technology alongside these tech titans.
Visual design is no longer an afterthought; it's a need of the hour in the innovation journey. Tech companies recognize this, so they're integrating next-generation AI capabilities (GenAI) into popular design tools like Adobe Photoshop, Figma, InVision, and many more. This integration further amplifies the power of visual communication. This allows them to focus on crafting clear, compelling visuals that explain complex functionalities within user manuals and guides, leading to intuitive user experiences.
We witness this at EZ, a global leader in graphic design solutions. Our top-tier tech clients increasingly recognize the critical role of exceptional visual design in user documentation. They understand that clear, compelling visuals powered by GenAI are the key to leveraging the full potential of their innovations and ensuring successful user adoption.
How Graphic Design Experts Shaping User Behavior and Driving Adoption with Tech
While the introduction highlighted the visual appeal of user documentation, the true power of visual design goes beyond basics. Visual graphic designers are leveraging rigorous technological tools to shape the future of technology by influencing user behavior and driving adoption. Here's how:
Building Mental Models with User Flow Mapping Tools
Imagine a user encountering a new software. Designers create clear and consistent user flows using tools like Miro or UXPin. These tools allow them to map the user journey, utilizing visual elements like flowcharts and wireframes to define the logical progression and establish a clear visual hierarchy. This helps users build mental models of the software, allowing them to integrate features intuitively and efficiently.
Studies by Nielsen Norman Group show that clear and consistent user flows can reduce task completion time by up to 50%. By using resilient tools, designers ensure a smooth and intuitive user experience, leading to higher adoption rates and user satisfaction.
Designing for Action with Interactive Prototyping Tools
User documentation shouldn't just inform; it should motivate users to take action. Designers craft engaging CTAs (calls to action) using tools like Figma or Adobe XD. Imagine a user encountering a visually appealing infographic created in Canva highlighting the benefits of a new feature, accompanied by a prominent button labeled "Get Started," designed in Sketch. This combination of visual communication and clear action prompts, facilitated by these design tools, encourages users to explore and adopt new functionalities.
Emotional Connection Through Data-Driven Visual Storytelling
Technology is more than just features; it can solve problems and improve lives. Designers leverage data from user research tools like Hotjar or Crazy Egg to understand user needs and emotional triggers. This data informs the creation of visual stories using tools like Adobe Illustrator or After Effects. Consider a user manual that opens with a well-crafted animation depicting a user overcoming a typical challenge with the help of new technology. This emotional connection fostered through data-driven visual storytelling and animation tools motivates users to embrace the product's potential fully.
Simplifying Complexity with Visual Metaphors
Jargon can be a barrier. Designers use visual metaphors (think icons and illustrations) created with tools like Adobe Illustrator or Sketch. These universal symbols transcend language barriers, simplifying complex functionalities. Imagine a user encountering a cloud storage manual with a filing cabinet metaphor – folders represent storage options, making the concept easy to grasp for all users.
Fostering Accessibility with Design for All
Designers can craft user experiences that are accessible to all by utilizing tools with built-in accessibility features. Imagine a user manual that seamlessly blends clear text with audio descriptions and image alt text. This approach, supported by tools like Adobe XD and Figma's accessibility plugins, ensures everyone has equal access to information, regardless of ability.
A/B Testing for Optimal Engagement
What resonates with users? Designers leverage A/B testing tools like Optimizely or Google Optimize. These tools allow them to create different versions of visuals and user interfaces and track user engagement to determine the most effective design choices. Imagine a user encountering two versions of a user manual infographic—one minimalist and one playful. A/B testing helps identify which version captures user attention and fosters better engagement.
Building Interactive Overlays with Augmented Reality (AR)
Static manuals provide more context. Designers are exploring AR integration using platforms like Apple ARKit or Google ARCore. These platforms allow them to create interactive overlays that enrich the user experience. Imagine a user encountering an intelligent appliance manual. By pointing their phone at the appliance, they can access AR overlays highlighting specific functionalities and troubleshooting steps, providing a more interactive and context-aware learning experience.
Interactive Troubleshooting Guides
Imagine users encountering an unfamiliar issue with a new IoT device. Interactive troubleshooting guides, designed with clear visuals and branching decision trees (powered by authoring tools like Adobe RoboHelp), allow users to diagnose and resolve problems independently, fostering a sense of self-reliance and reducing reliance on traditional support channels. The mobile-first design ensures accessibility across devices.
Customizable User Dashboards
User interfaces (UIs) built with Figma or Adobe XD allow personalized learning within user documentation. Users can prioritize and filter functionalities relevant to their needs (through drag-and-drop and checkboxes) for continuous learning and adaptation as features evolve. Advanced dashboards can integrate with user data using APIs for personalized insights.
Also read: How a Graphic Design Services Provider Helps Top Companies Succeed
What’s Next?- Design Drives Adoption, Made Easy with EZ

Visual design, paired with smart tech tools, unlocks user adoption. Many leaders recognize this, but ensuring a seamless, cost-effective transition can be challenging.
At EZ, a global leader in graphic design known for consistent, high-quality output, round-the-clock available subject-matter experts, and faster-than-the-fastest speed, we make the shift to impactful visual design effortless. Our team of graphic design experts will work closely with you to craft user experiences that:
- Empower users: Reduce support costs with clear and interactive documentation.
- Boost adoption: Engaging visuals and personalized learning experiences drive engagement.
- Increase user satisfaction: A seamless experience paves the way for long-term product loyalty.
Don't let the complexities of design implementation slow you down. Partner with EZ today and unlock the value of design for your user experience. We'll guide you through the process, ensuring a smooth transition that maximizes your return on investment.